Powered by Semantic AI:
Next-Level Insights for
Beverage Data Analytics
bevlYtics.ai leverages Semantic AI—an advanced technology combining machine learning (ML), natural language processing (NLP), and knowledge graphs—to transform raw distributor and point-of-sale (POS) data into meaningful insights that drive growth and strategic execution.


Built for Beverage Distributors. Trusted by Analysts
Whether you manage stock, track sales, or coordinate with distributors — your data should work for you.
Real-Time Dashboards
Monitor trends across styles, SKUs, and segments instantly.

SKU & Size Analysis
See what sizes move best - by region, brand, or distributor.

New Product Analysis
Track launch success with early sales and market response.

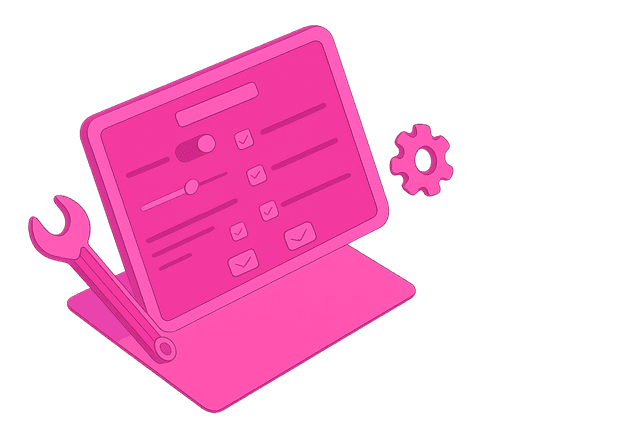
Data Upload Engine
Upload messy Excel files - bevlYtics AI Engine does the cleanup.
Built to Solve Your Everyday Challenges
No more guesswork — just real-time answers, built for modern Beverage operations.
Sales data is often siloed by distributor, region, or SKU — making it hard to get a clear picture.
- Live dashboards show exactly what's moving — by SKU, size, region, or sales channel.
- Segment filters let you zoom in or out — from product-level to portfolio-wide.
- Exportable reports give your team instant clarity.
Manual data cleaning slows down reporting and introduces errors.
- Upload raw Excel or CSV files — bevlYtics automatically structures, validates, and transforms the data.
- Eliminate human error and save hours of work each week.
- Standardized outputs make reporting consistent across teams.
Waiting months to know if a new product is working wastes opportunity.
- New Product Analysis dashboard tracks velocity, region-wise pickup, and distributor traction.
- Spot early signals of success (or failure) by SKU size, format, or style.
- Make pricing, packaging, or placement tweaks based on data — not instinct.
Tracking performance across multiple SKUs, pack sizes, or brand extensions is chaotic.
- Brand Family Tracking lets you view aggregate or individual SKU-level data.
- Compare how 12-packs perform versus singles or seasonal variants.
- Filter by size, segment, or market — in one view.
Smarter Operations, Powered by AI
Track, forecast, optimize, and report — all in one automated platform.
Automated Weekly Reports
Zero manual effort. Full operational clarity.
Live Inventory Tracking
See what's in stock, where it is, and how fast it's moving.
Stock Alerts
Stay proactive — not reactive.
Price Optimization
Find the sweet spot between margin and movement.
Clean Data Pipeline
Say goodbye to errors, inconsistencies, and cleanup headaches.
Fulfillment Gap Detection
Upload messy Excel files and let AI handle ingestion, structure, and cleanup in real-time.
Distributor Analytics
Compare, rank, and optimize your distributor network.
Lost Sales Finder
Uncover the sales you didn’t even know you missed.